letter - frequency data analysis
historical context:
The most famous contribution in to letter frequency in the English language came from Mark Mayzner. He conducted research on letter frequencies in the English language, primarily focusing on the analysis of how often individual letters appear in written texts. His work involved the creation of frequency lists that ranked letters based on their occurrence in written materials. This research contributed to a better understanding of the distribution of letters in the English language and provided valuable data for various applications, including cryptography, text analysis, and linguistics.
Mayzner’s 1965 study titled "Tables of Single-letter and Digram Frequency Counts for Various Word-length and Letter-position Combinations" involved the compilation and analysis of data related to the frequency of single letters and letter pairs (digrams) in written texts of varying word lengths and letter positions. This research aimed to provide comprehensive tables that document how often specific letters and letter pairs occur in different linguistic contexts.
Mayzner's work with letter frequencies helped uncover patterns in written language and offered practical insights into the structure and usage of letters in text, which remains useful for researchers and professionals working with textual data, particularly those seeking to analyze or manipulate letters and digrams within words in a systematic and data-driven manner.
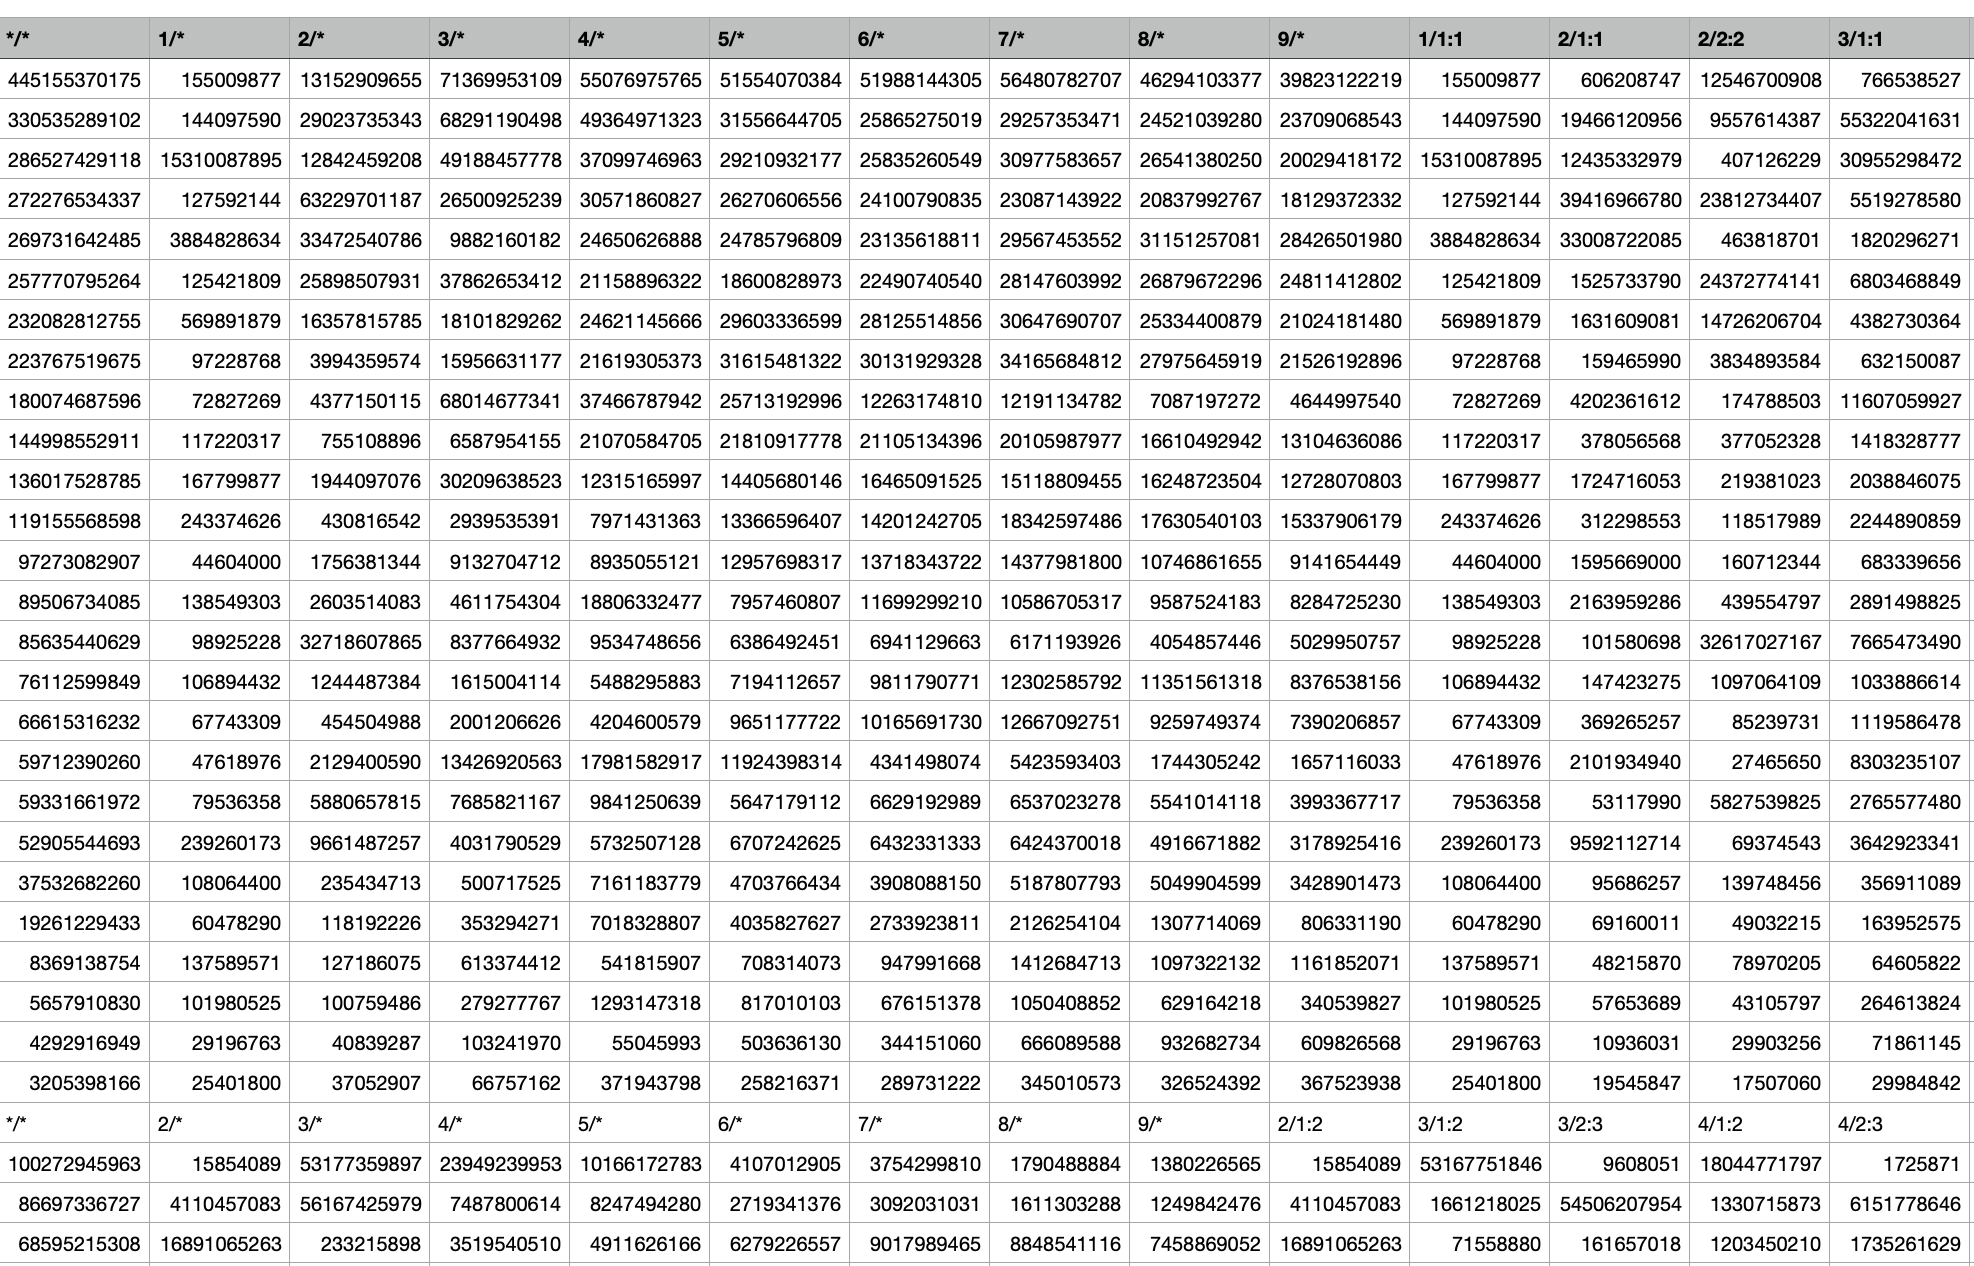
Mayzner’s work was collated through the analaysis of 20,000 words in a labor-intensive method. Today with the readily available power of computers & text digitization, Peter Norzig replicated and expanded on Mayzner’s project. Distilling Google Books data, the sample size was 37 million times Mayzner’s.


a process:
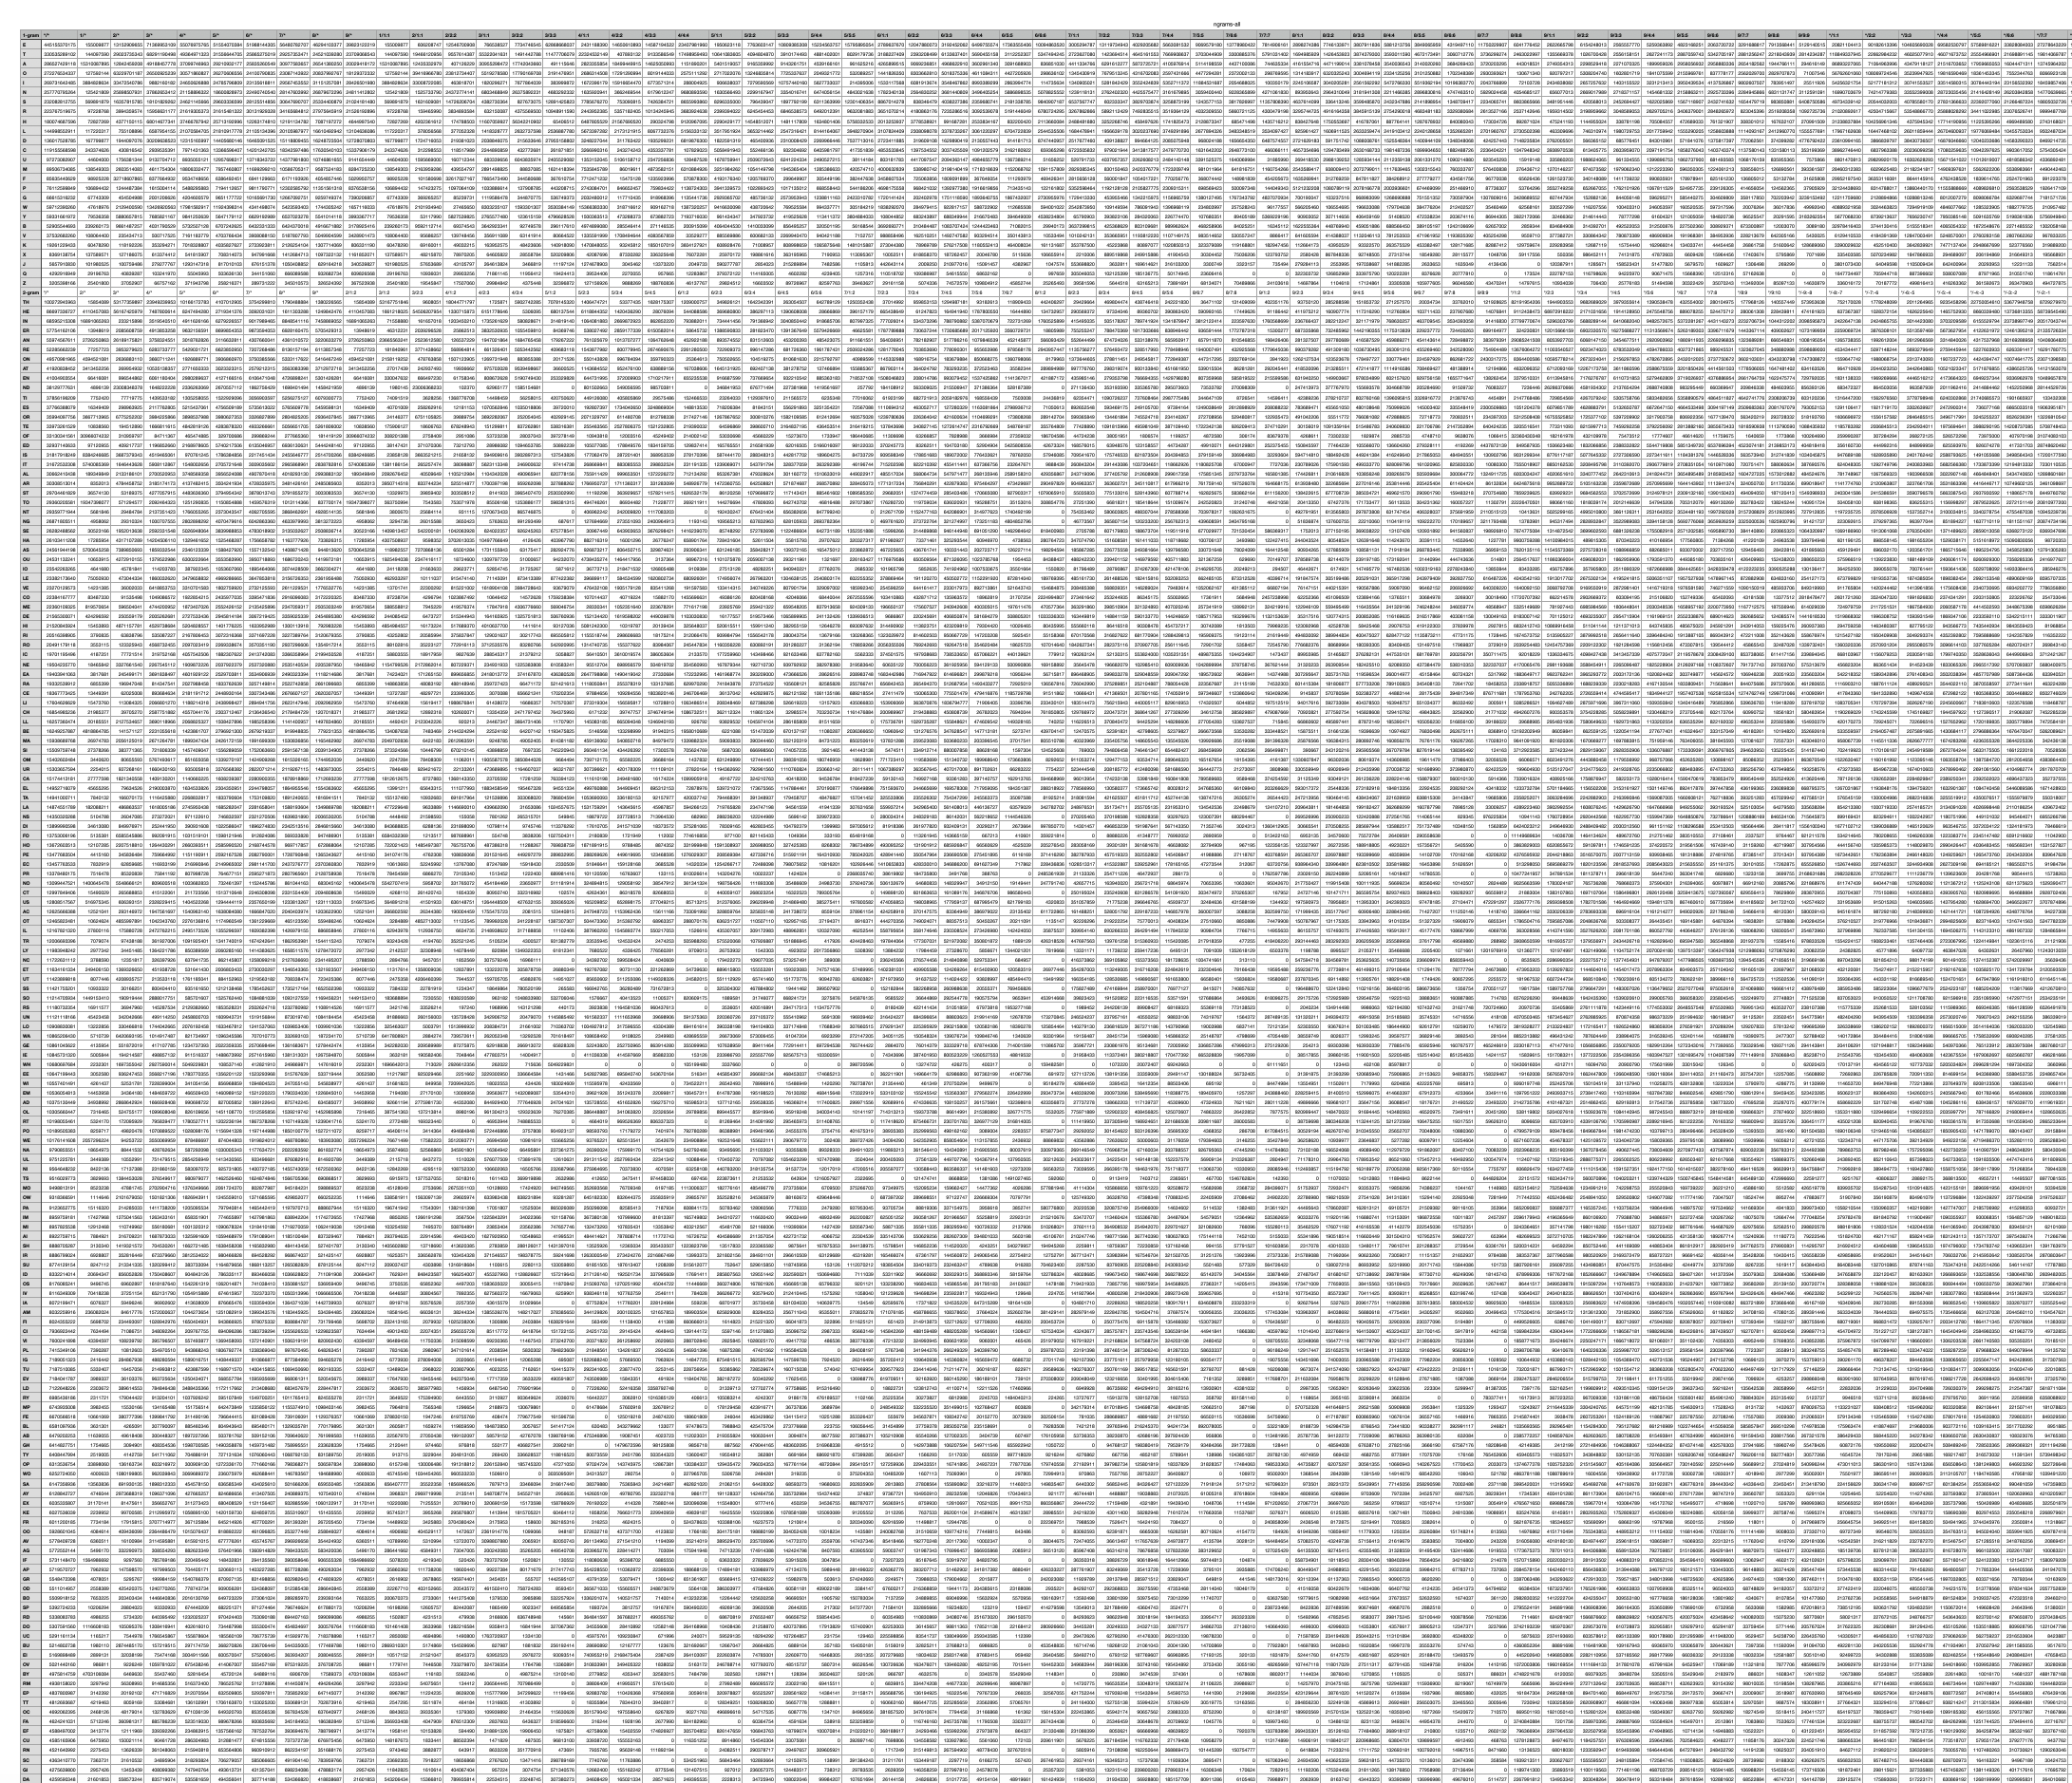
It was Norvig’s dataset which I extrapolated. 37,428,682 entries.
However I discarded all data which related to letter frequencies positioned anywhere within the word (*/*) given that I was focusing on frequent beginning & ending letters, bigrams and trigrams.
From this data, I discarded all single-letter words (A, I), and two letter words (eg in, on, at etc) and finally in the trigram analysis I discarded all three letter words . I then had a truer picture of the n-grams, bigrams and trigrams which made up words up to nine letters in length, positioned at the very start and very end of the words.
In the subset of bigrams and trigrams, I further selected only those with a count of above 1 billion. Solely because I needed to work with a smaller dataset and this seemed a statistically significant number. It still gave me 100s of thousands of entries but was more manageable for the timeframe of this brief.
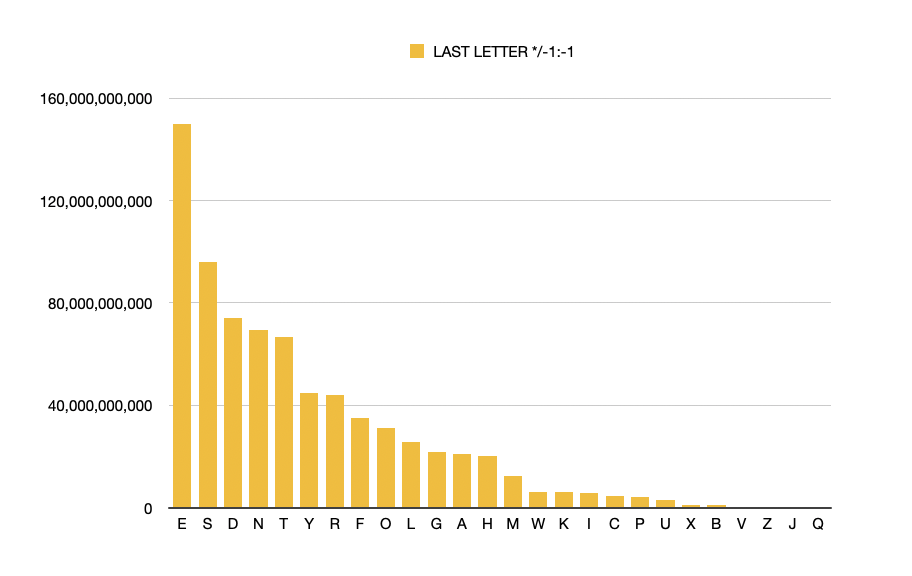
I’m no statistician and there have been moments the past few weeks I have come so lost in the numbers I have forgotten what I was looking for. Every now and then I had to stop and export a chart, so that I could visualize where I was at and where I needed to go.
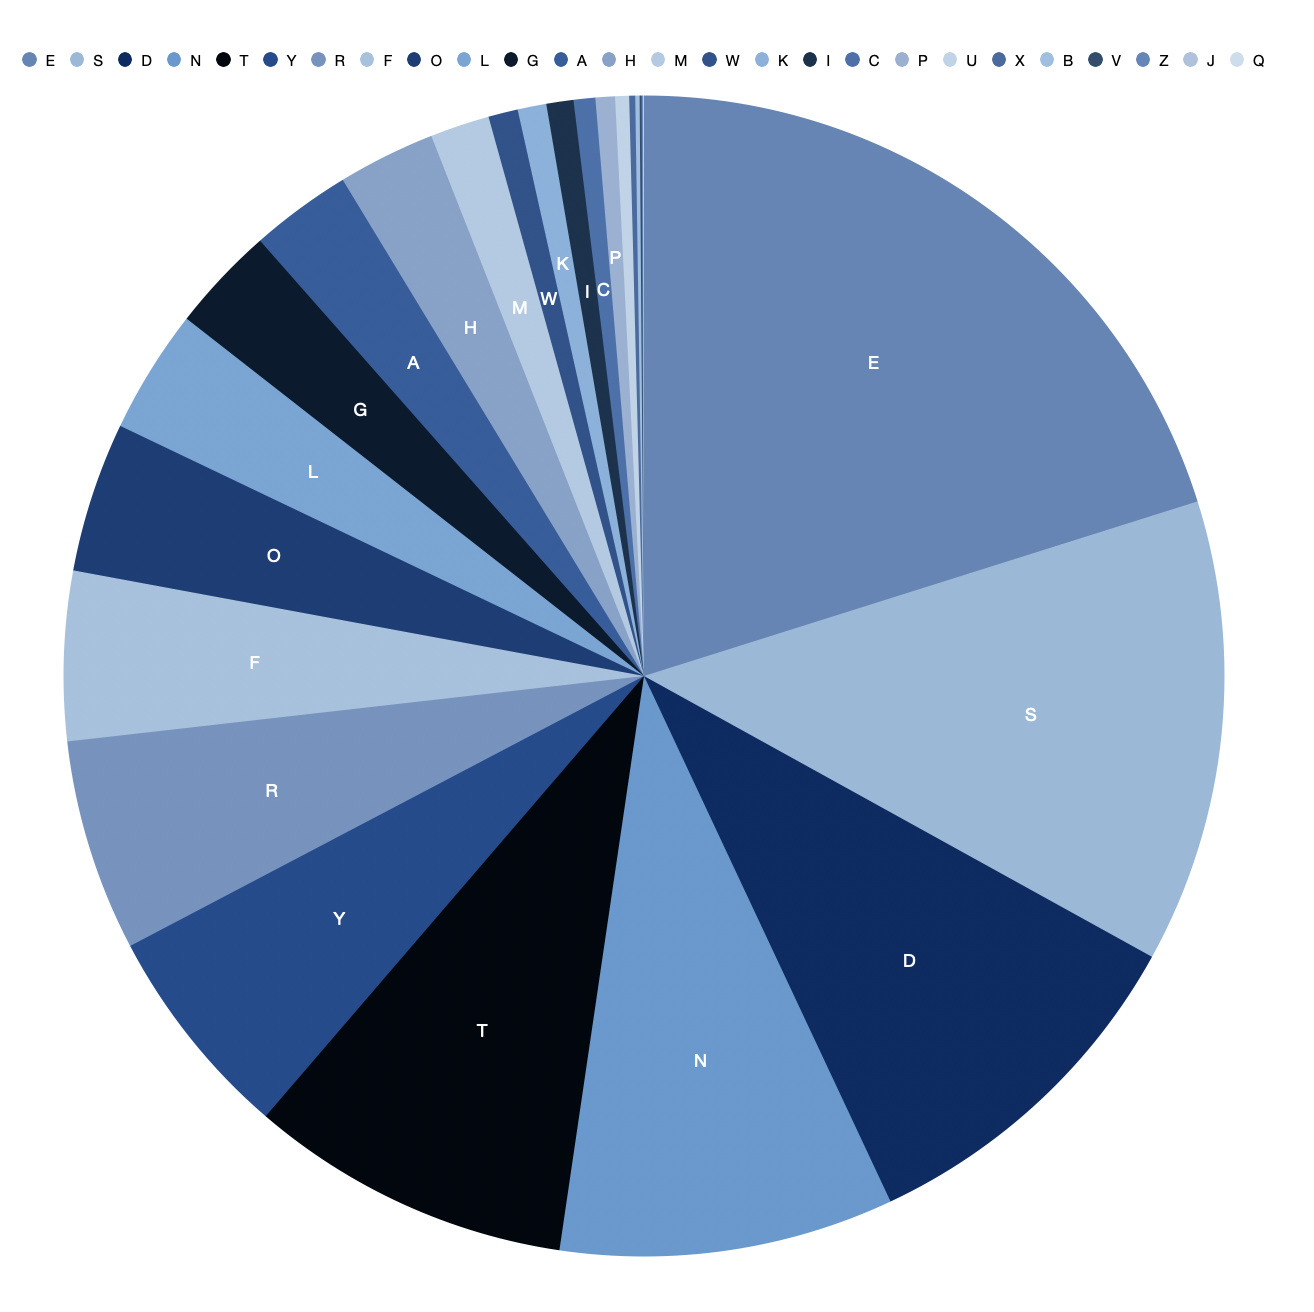
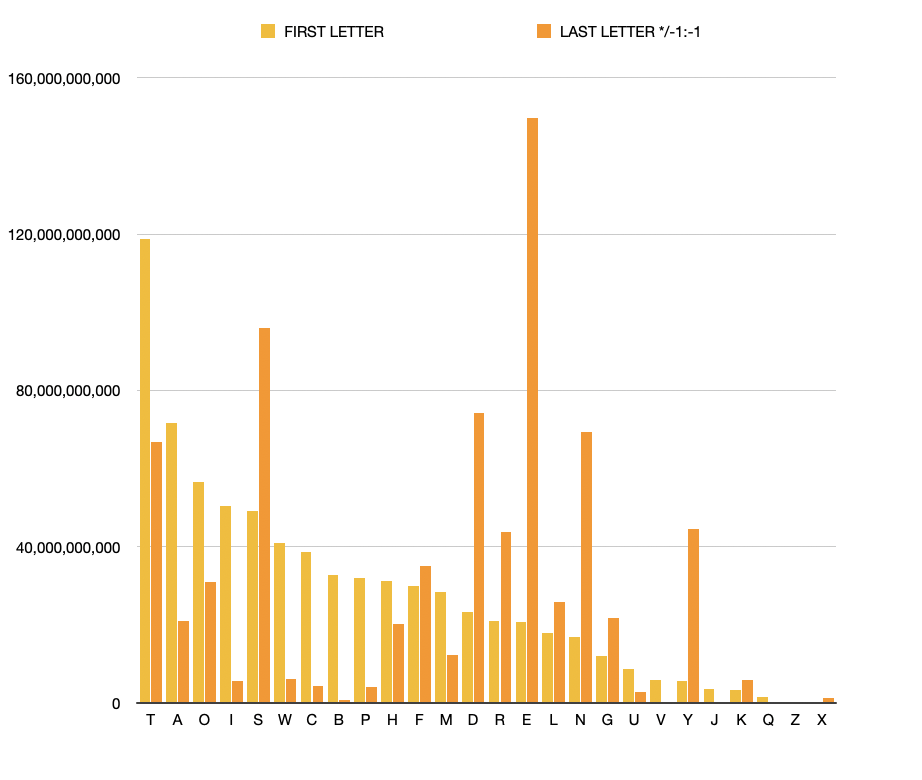
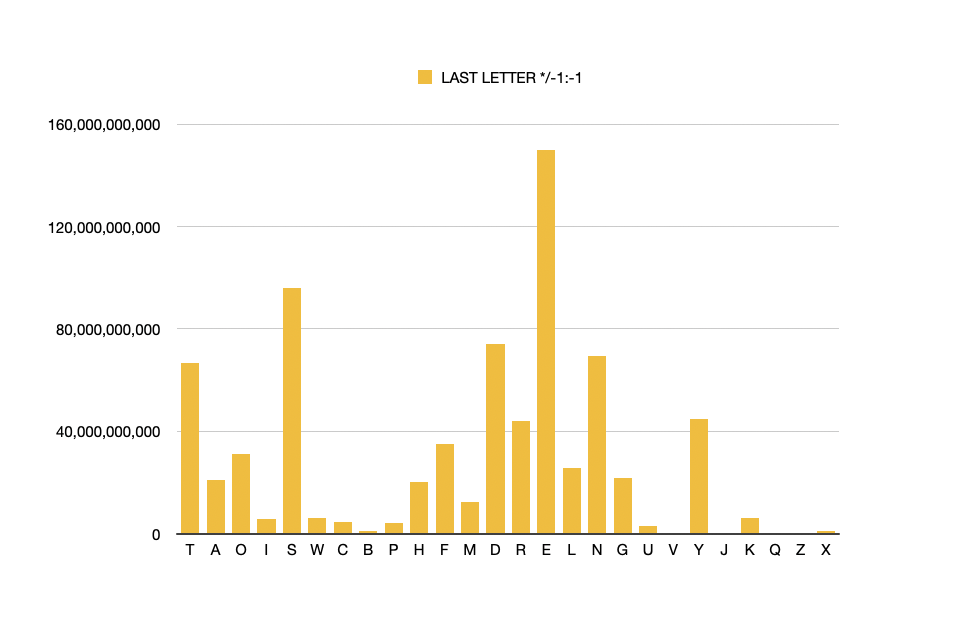
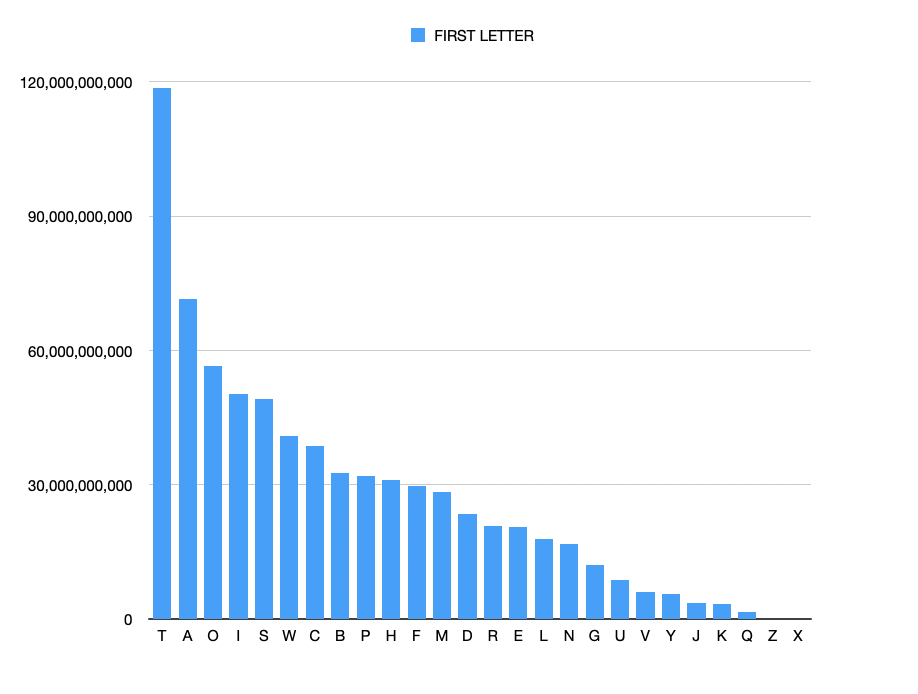
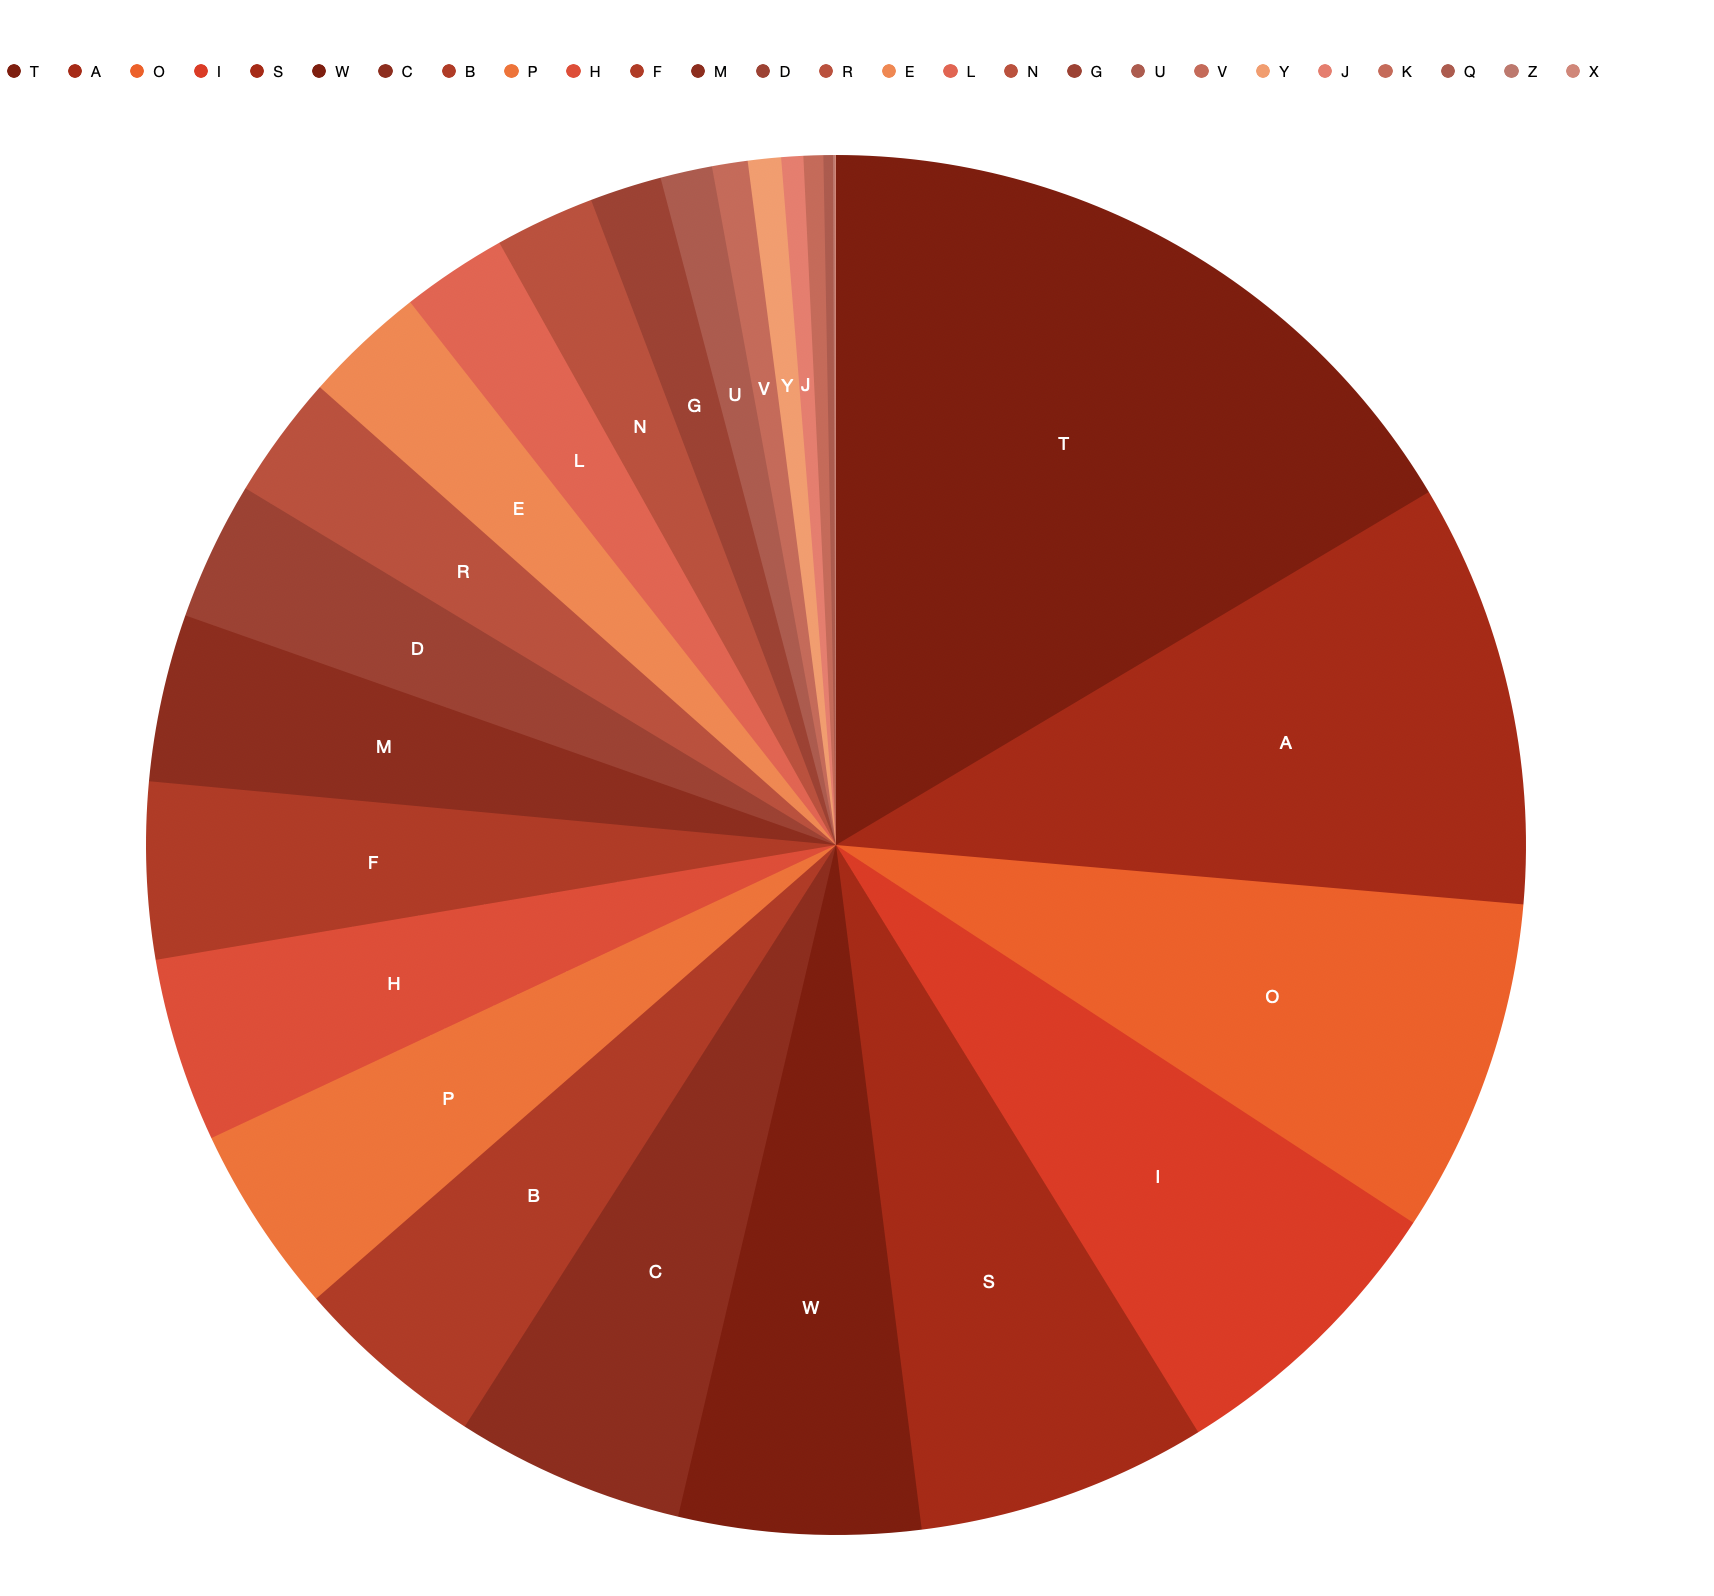
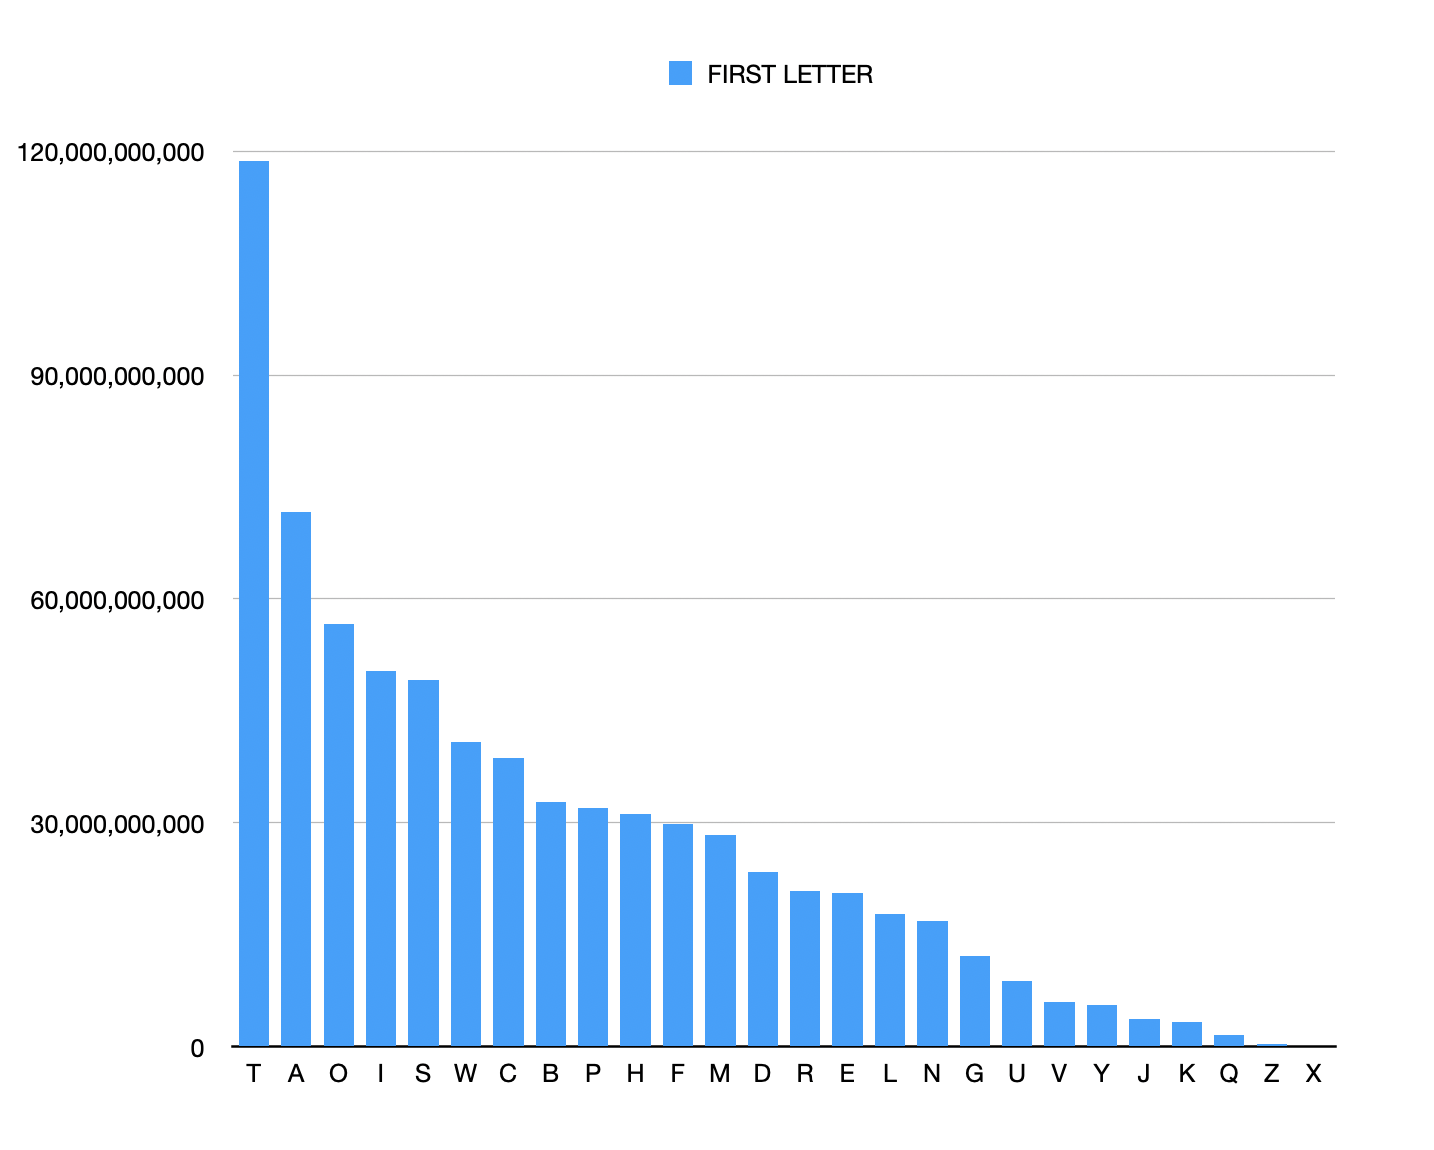
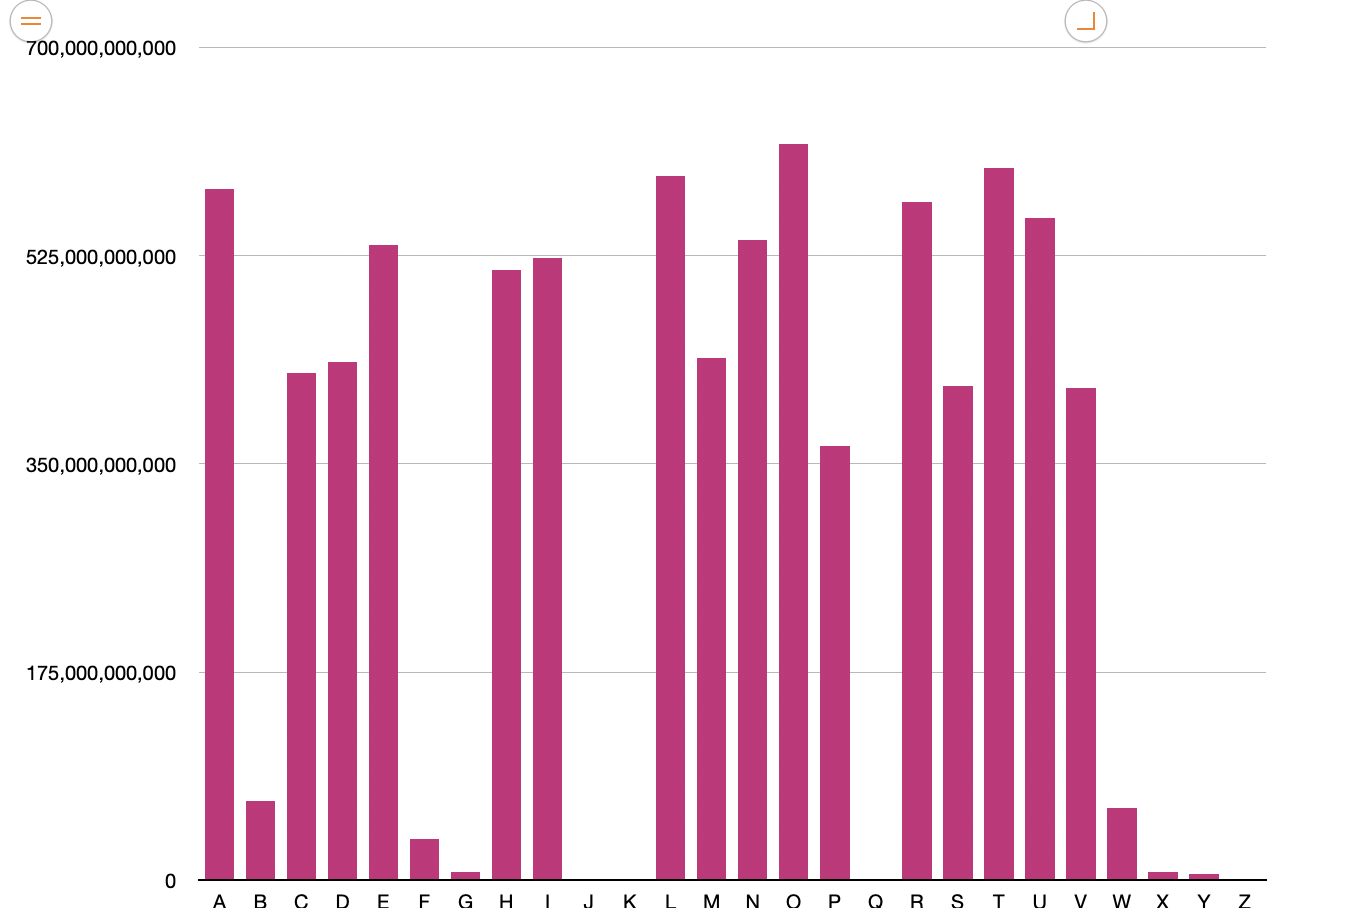
It wasnt until I started depicting the data more graphically that I could see the patterns. So for the beginning letter of each word, I worked out a proportionate text size and plonked the letters into an A4 adobe artboard.
Black on white: beginning letter frequency.
White on black: ending letter frequency.


